Real-time monitoring helps you improve AI code by spotting problems early, managing resources better, and boosting performance automatically. Here’s why it matters:
- Catch issues fast: Detect memory leaks, slow queries, or bottlenecks before they cause problems.
- Optimize resource use: Track CPU, memory, and network usage to avoid waste.
- Adapt to demand: Automatically scale resources during high-traffic periods.
Monitor Your AI Agents with AgentOps: Build Production ...

Benefits of Real-Time Code Monitoring
Real-time code monitoring helps improve AI code performance by identifying issues quickly and managing resources more effectively. Here's how early detection, resource management, and automated scaling play a role in enhancing performance.
Early Problem Detection
Real-time monitoring acts as a constant watchdog, scanning execution patterns to catch problems like memory leaks, slow database queries, API bottlenecks, or resource-intensive processes. This allows developers to fix issues before they disrupt system stability or performance.
Resource Management Insights
AI applications often require heavy computational resources, making efficient resource use critical. Real-time monitoring provides detailed insights into:
- CPU Usage: Tracks processor activity, identifies CPU-intensive tasks, and evaluates thread performance.
- Memory Usage: Monitors memory patterns, flags leaks, and helps optimize cache usage.
By leveraging this data, developers can ensure resources are allocated efficiently, keeping systems running smoothly.
Dynamic Performance Scaling
Modern systems go beyond monitoring - they actively adjust performance in real time. By detecting workload changes and reallocating resources dynamically, these systems maintain steady performance even during high-demand periods. This ensures the application adapts seamlessly to varying usage levels.
Core Monitoring Functions
Real-time monitoring systems rely on three main functions to keep AI code running smoothly: data collection, pattern recognition, and continuous improvement. These functions turn raw data into actionable insights, helping maintain and improve performance.
Performance Data Collection
Monitoring systems gather performance metrics through tools that track key indicators in real time. These metrics fall into three categories:
- System Metrics: Includes CPU usage, memory allocation, disk I/O, and network traffic.
- Application Metrics: Tracks response times, error rates, and throughput.
- Custom Metrics: Focuses on business-specific KPIs and other tailored indicators.
The collected data is displayed on dashboards, giving an instant view of system performance. For instance, when monitoring an AI model's inference pipeline, the system observes metrics like:
| Metric Type | What's Measured | Update Frequency |
|---|---|---|
| Latency | Response time per request | Every 100ms |
| Memory | RAM usage patterns | Every second |
| Throughput | Requests processed per second | Every 5 seconds |
Pattern Recognition
Pattern recognition algorithms analyze the incoming data to detect anomalies and performance issues. By establishing a baseline, these systems can identify deviations that might signal problems.
Key methods include:
- Baseline Analysis: Compares current performance with historical data to spot irregularities.
- Anomaly Detection: Flags unusual patterns that could indicate errors or inefficiencies.
- Trend Analysis: Monitors performance over time to predict potential future issues.
This analysis ensures timely action. For example, if the system detects a spike in latency, it can trigger alerts or apply predefined fixes to prevent downtime or degraded performance.
Continuous Improvement
The final function focuses on using the data and insights gathered to refine and enhance performance over time. This involves:
- Performance Trending: Studying long-term data to uncover optimization opportunities.
- Automated Optimization: Making automatic adjustments based on observed patterns.
- Predictive Maintenance: Anticipating and addressing potential issues before they impact performance.
For AI systems, this feedback loop is crucial. The monitoring system tracks factors like model inference times, resource usage, and accuracy. If problems arise, it can adjust resources or even retrain the model automatically to maintain peak performance.
sbb-itb-7101b8c
Monitoring Examples for Beginners
Here are some beginner-friendly ways to use real-time monitoring to improve AI code performance.
Speed Optimization
Real-time monitoring can highlight slow API calls, making it easier to implement fixes like caching. For instance, if your AI code often retrieves similar data, monitoring tools can reveal delays in API response times and repeated data requests. With this information, you can set up caching for frequently accessed data, which speeds up responses and reduces server strain. These improvements can be tracked on a monitoring dashboard for better visibility.
Besides improving speed, monitoring also helps uncover operational bugs.
Bug Detection
Modern monitoring tools are great at catching errors before they affect users. By analyzing how your code runs, these tools can flag unusual patterns that may point to bugs. Some key features include:
- Error Rate Tracking: Keeps tabs on how often specific errors occur.
- Stack Trace Analysis: Identifies the exact part of the code where errors happen.
- Performance Drops: Spots sudden decreases in performance.
- Memory Leak Alerts: Warns when memory usage grows abnormally.
These tools log potential issues and can send automatic alerts when certain thresholds are crossed, allowing developers to fix problems early in the development process.
Real-time monitoring doesn’t just stop at bugs - it also helps manage server resources efficiently during high-traffic periods.
Server Resource Management
When server resources are stretched during peak usage, real-time monitoring becomes especially useful. A well-set-up system can track resource usage and take proactive steps like:
- Dynamic Resource Allocation: Automatically scaling resources when usage increases.
- Usage Pattern Analysis: Monitoring trends in resource consumption to predict when extra capacity will be needed. For example, you might notice CPU and memory usage spike at specific times, signaling when to scale up.
- Automated Responses: Triggering actions like adding more servers during busy times, optimizing database queries, or temporarily limiting activity. These steps help maintain performance while keeping costs under control.
Getting Started with Monitoring
Code Analysis Methods
Kick off your monitoring efforts by using essential code analysis tools that track performance in real time. These tools help identify issues and optimize your code effectively. Here are the main approaches:
- Static Analysis: Scans your code before it runs to detect potential bottlenecks.
- Dynamic Analysis: Observes how your code behaves during runtime to identify actual performance issues.
- Hybrid Monitoring: Combines static and dynamic analysis for a more complete view.
For smaller AI projects, lightweight tools like Python's cProfile or Node.js's built-in profiler can provide critical performance insights without overloading your system.
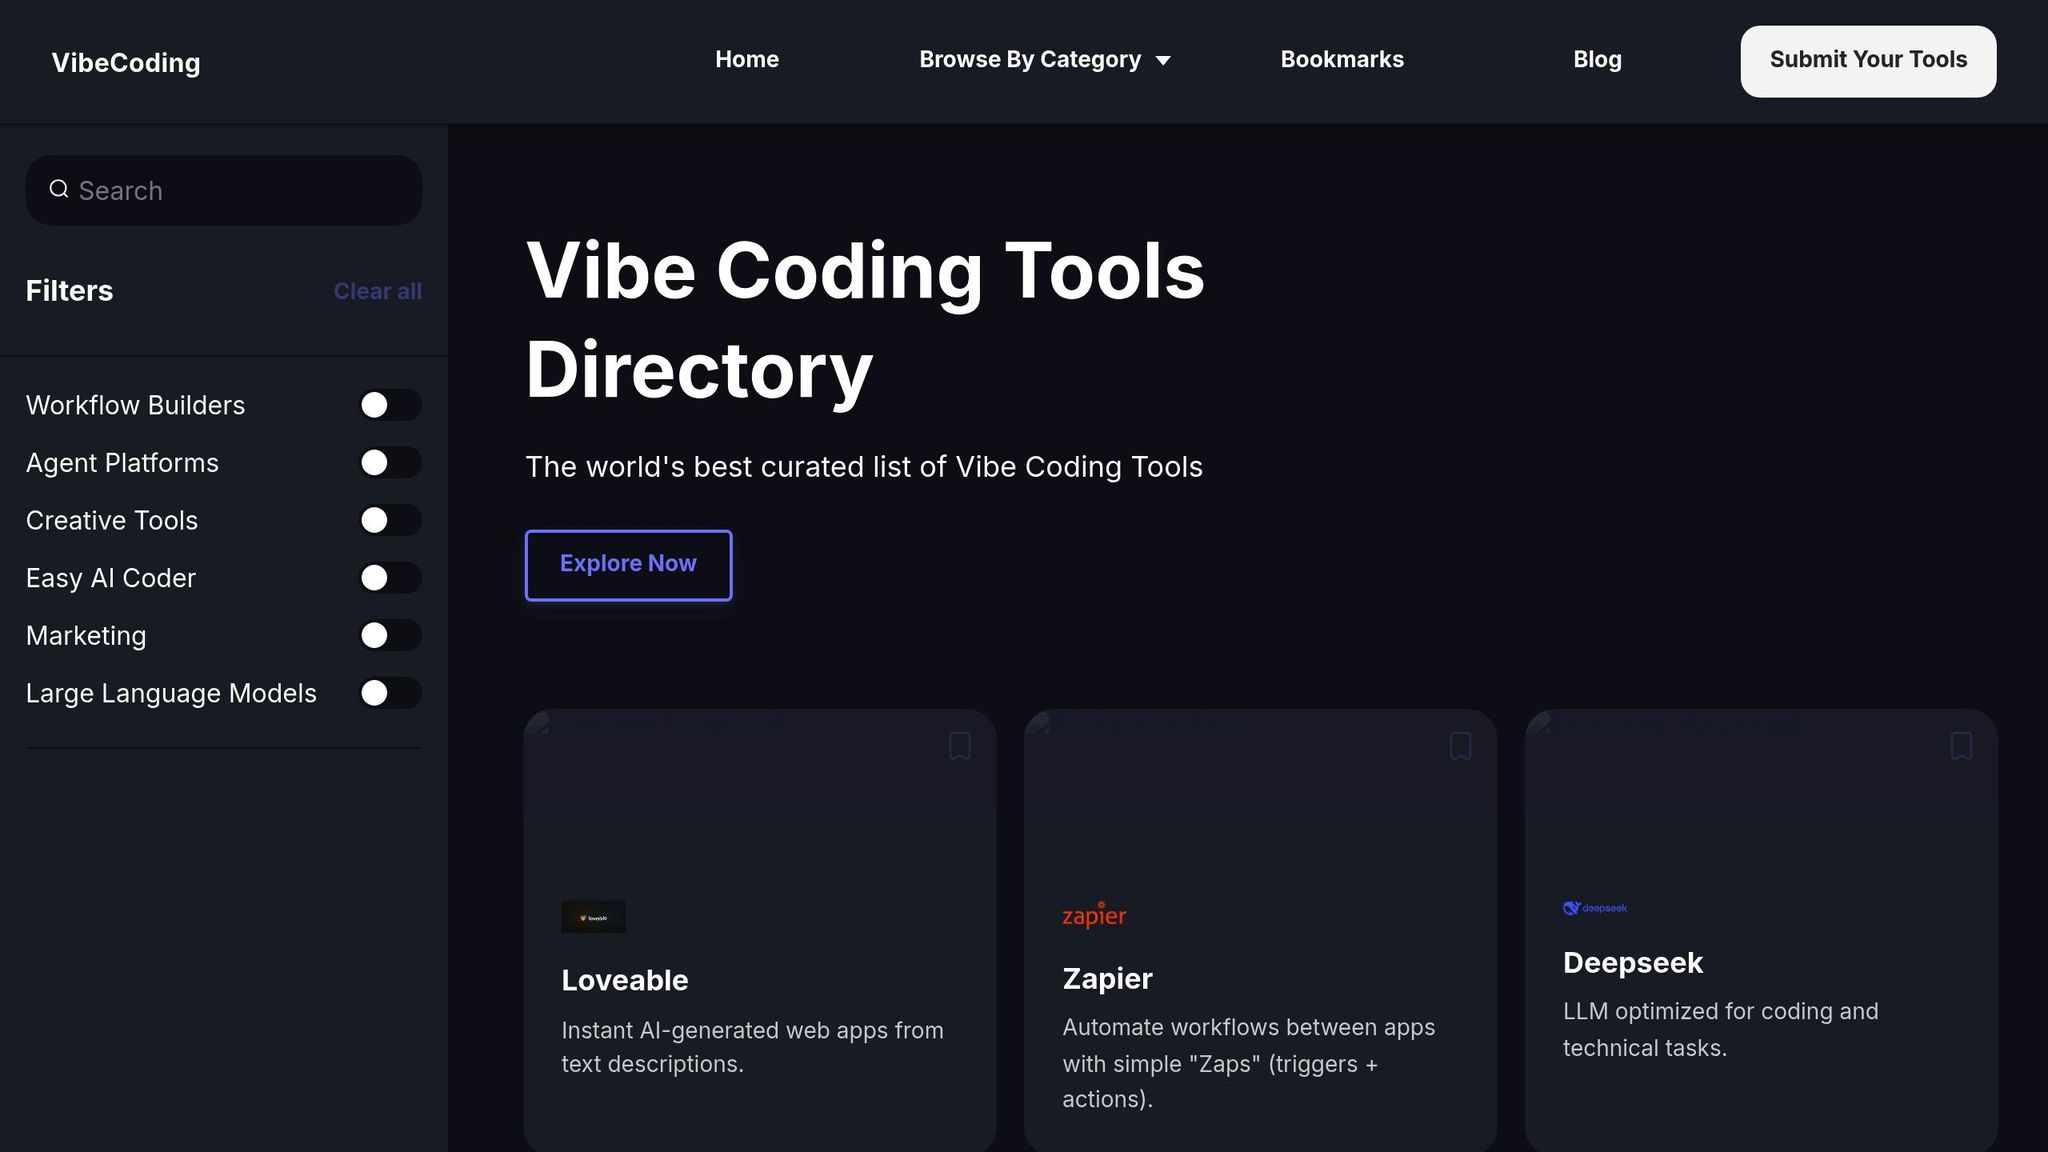
Vibe Coding Tools Directory

Once you've chosen your analysis methods, consider enhancing your setup with external resources. The Vibe Coding Tools Directory offers curated tutorials to help you establish performance baselines, set up dashboards, configure alerts, and analyze metrics effectively. The directory’s "Learn More" section includes practical guides tailored for monitoring AI code.
Learning Resources
Building a solid understanding of code monitoring requires the right learning materials. The Vibe Coding Tools Directory highlights several key resources to help you get started:
| Resource Type | Description | Focus Area |
|---|---|---|
| Basic Tutorials | Step-by-step guides for setting up tools | Initial configuration |
| Interactive Demos | Hands-on practice with monitoring tools | Real-time tracking |
| Advanced Guides | In-depth exploration of performance tuning | Advanced metrics |
Andrew Ng’s Vibe Coding 101 course, available through the directory, is an excellent starting point. It covers everything from configuring tools and interpreting metrics to automating monitoring and optimizing your code.
Summary
Real-time monitoring plays a crucial role in improving AI code by enabling early issue detection, better resource use, and ongoing enhancements. Here's a breakdown of the key monitoring functions - data collection, pattern recognition, and continuous improvement - covered earlier.
Key Takeaways
| Monitoring Aspect | Key Benefits | Implementation Tips |
|---|---|---|
| Performance Tracking | Detect issues early, reduce downtime | Use static and dynamic analysis tools |
| Resource Management | Improve server efficiency, cut costs | Monitor CPU, memory, and network usage |
| Continuous Improvement | Automate scaling, identify patterns | Set performance baselines and alerts |
These points highlight how real-time monitoring supports better performance and resource allocation. To get the most out of your monitoring systems, define clear performance benchmarks, use both static and dynamic code analysis, and rely on automated scaling tools.
For further learning, the Vibe Coding Tools Directory provides curated tutorials and tools to help you set up effective monitoring systems. Its "Learn More" section includes practical guides for building dashboards and configuring performance alerts. Continuous monitoring and regular adjustments, backed by structured resources like Andrew Ng's Vibe Coding 101 course, are essential for long-term success.


