AI debugging tools are transforming how developers find and fix bugs in code. They save time, improve accuracy, and reduce costs by automating error detection and offering real-time solutions. Whether you're a solo developer or part of a large team, these tools can streamline your workflow and keep projects on track.
Key Takeaways:
- Benefits: Faster debugging, fewer errors, and scalable solutions for large codebases.
- Use Cases: Web and mobile apps, enterprise software, and cloud systems.
- Challenges Solved: Eliminates manual error-checking, missed patterns, and documentation gaps.
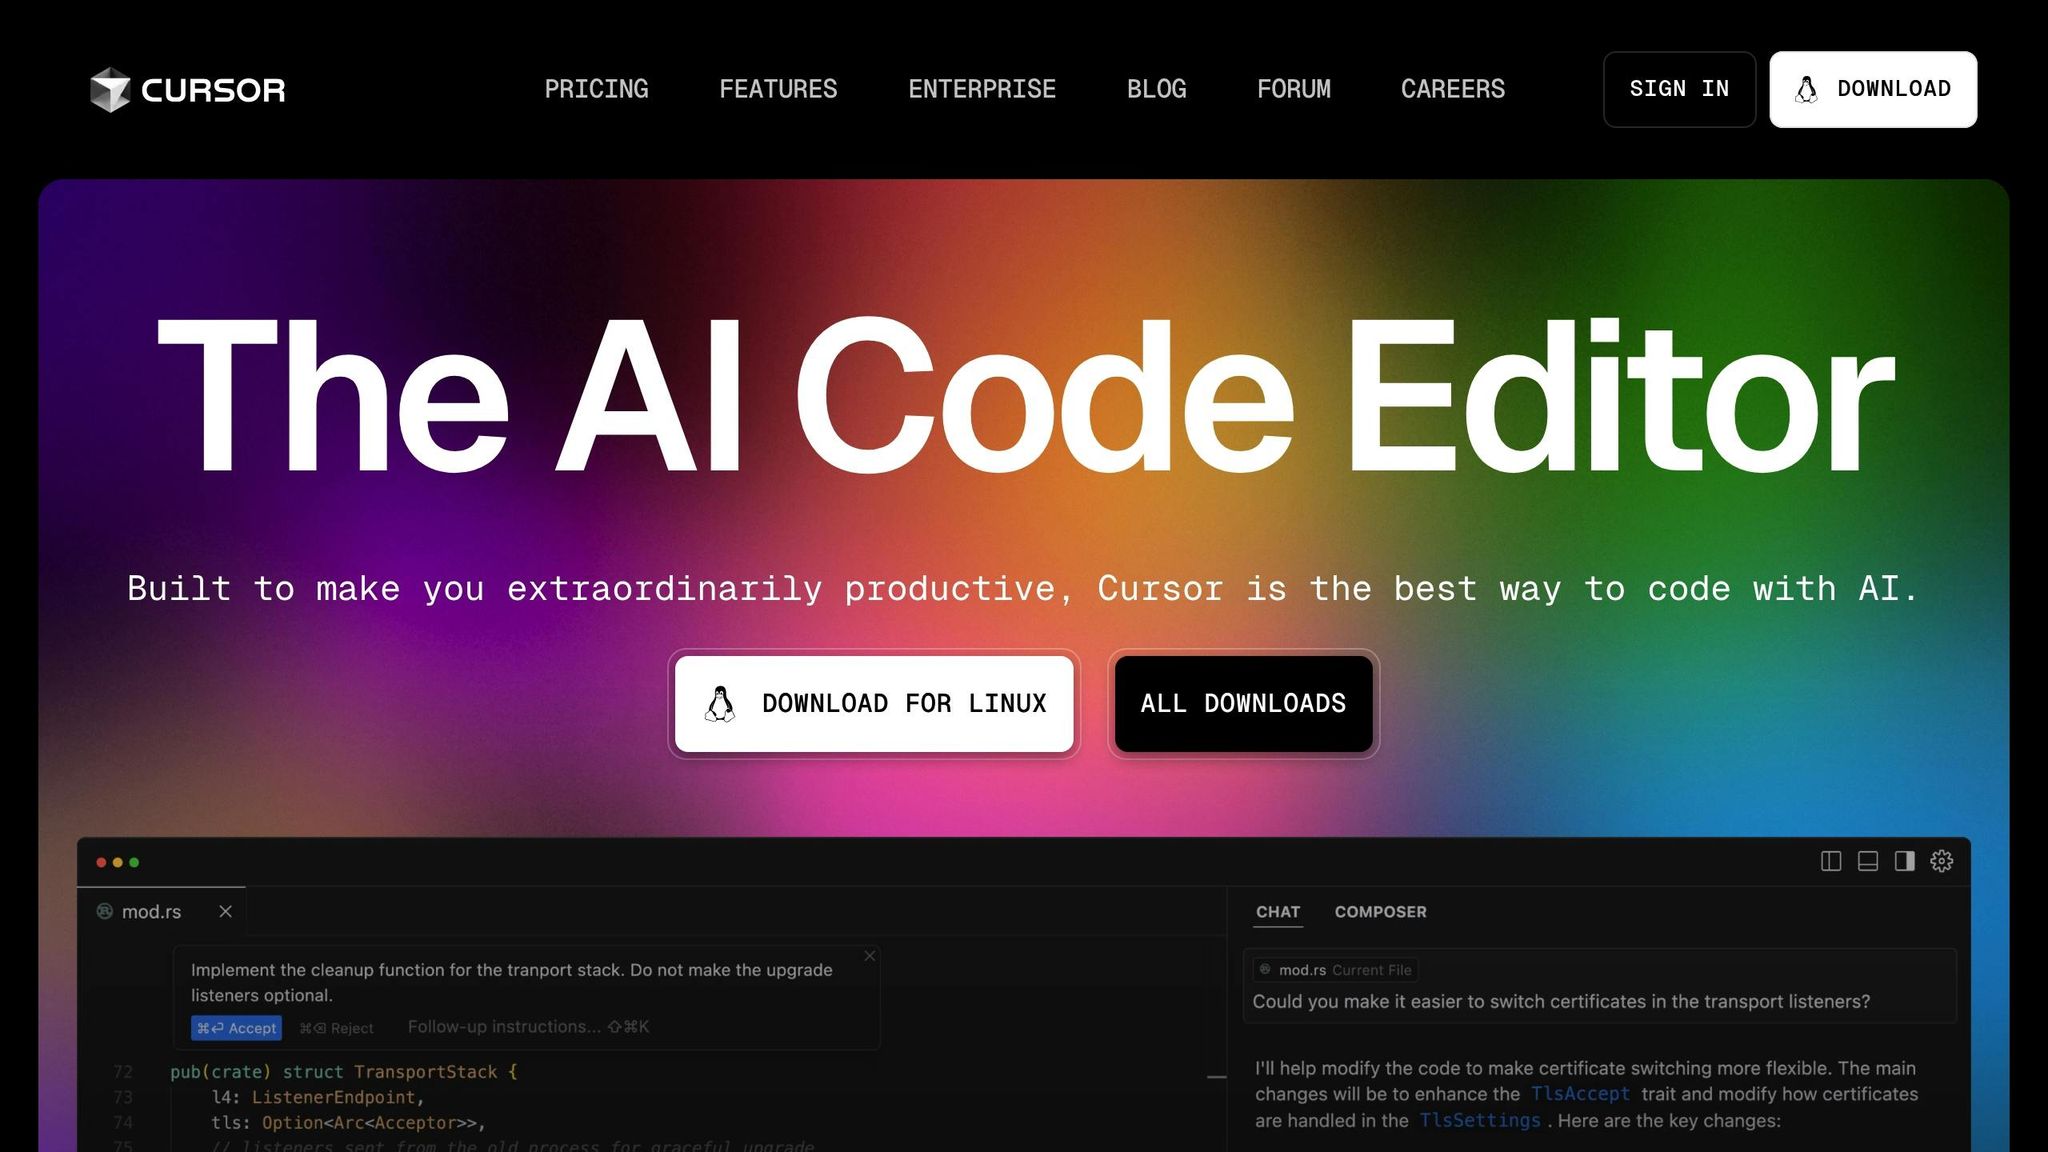
- Top Tools: Options like Cursor, GitHub Copilot, and Replit offer real-time debugging and AI-assisted code completion.
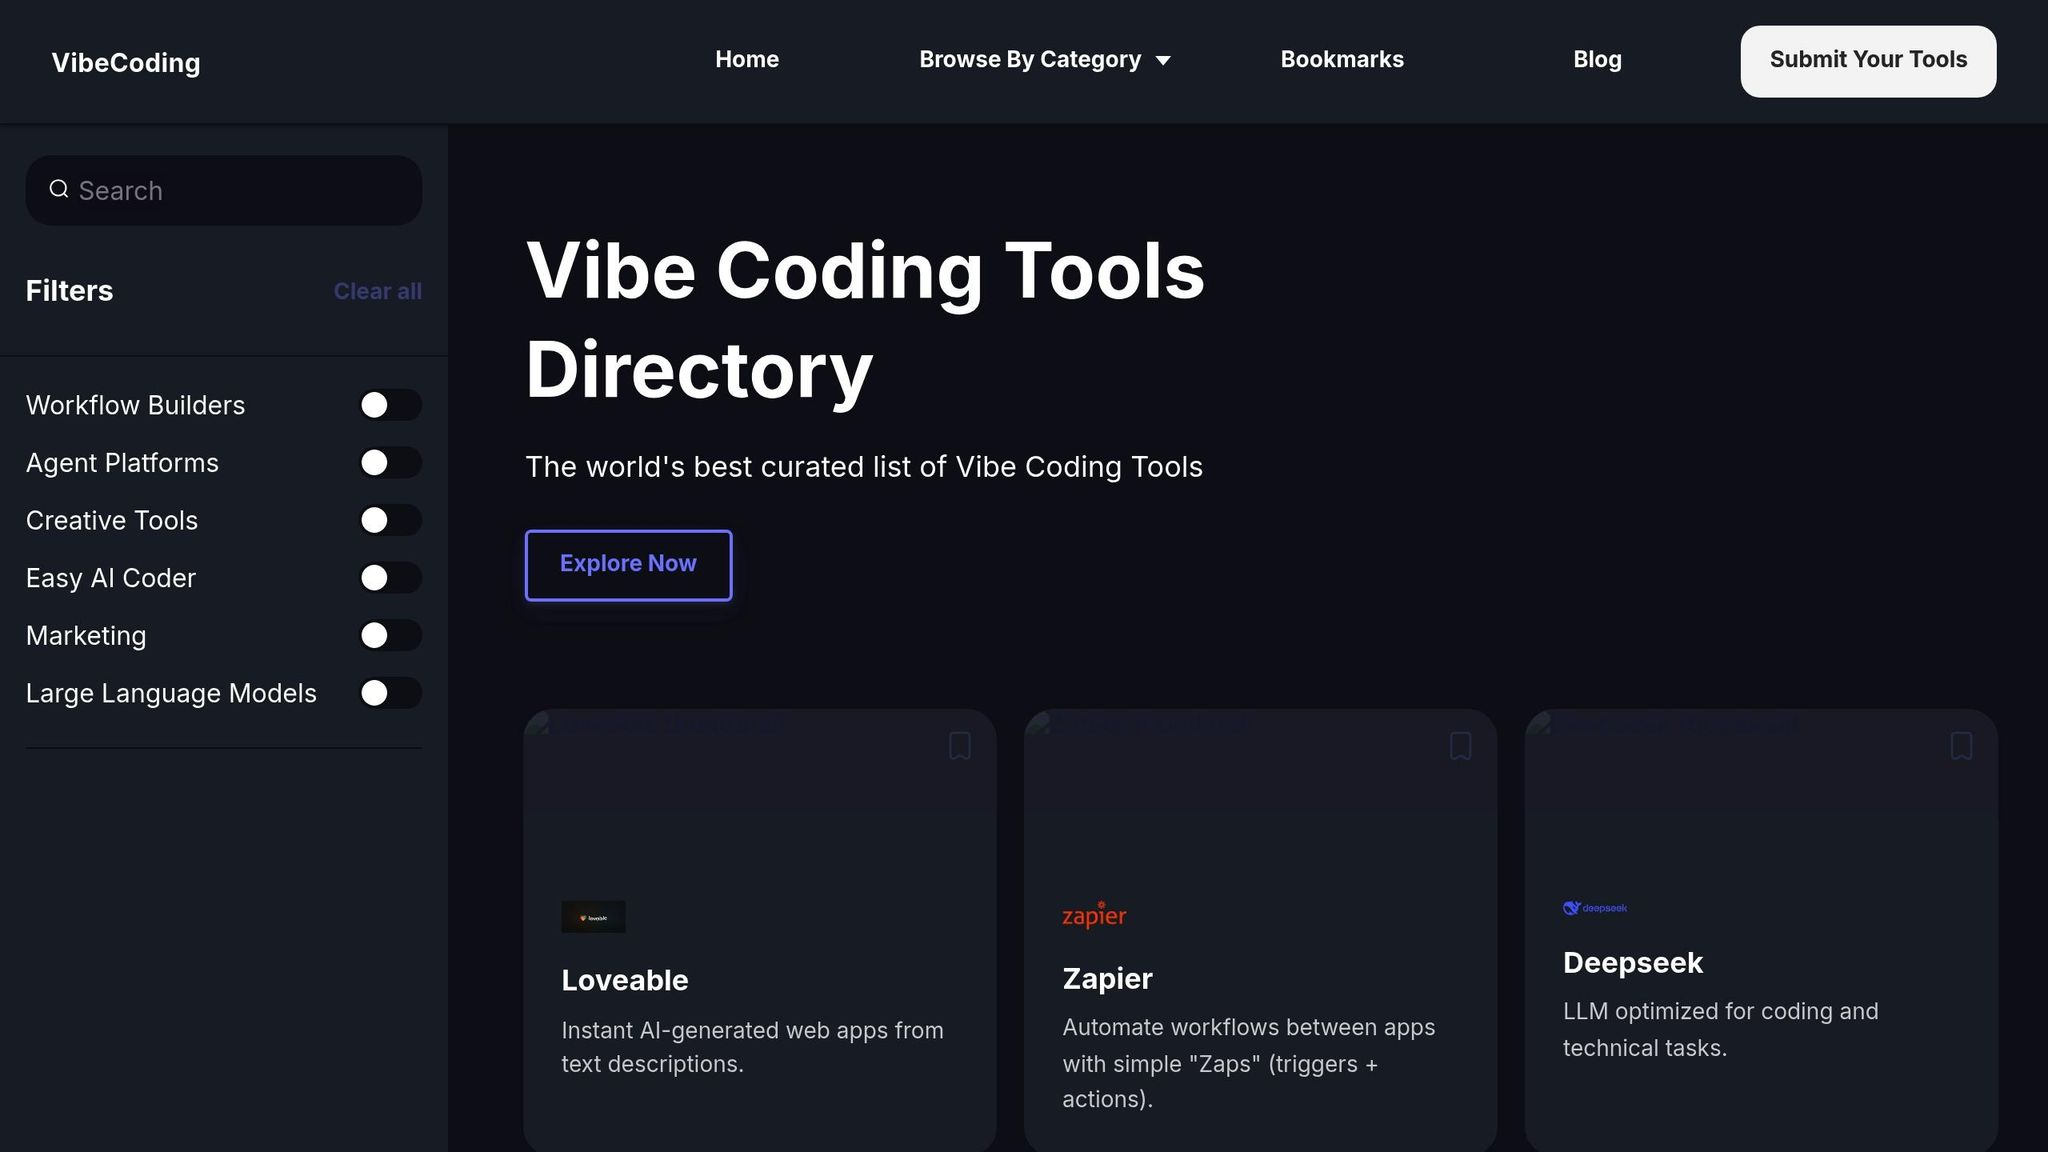
To get started, choose a tool that fits your project needs and budget, integrate it into your IDE or CI/CD pipeline, and combine AI scans with developer reviews for the best results. For a curated list of tools, check out the Vibe Coding Tools Directory.
Common Debugging Problems
Challenges with Manual Debugging
Manually debugging code can be a major drain on time and focus. Developers are often stuck reviewing code line by line, which not only takes a long time but also leaves room for mistakes.
Here are some common challenges:
- Interruptions hurt focus: Debugging requires deep concentration, and distractions can make it harder to get back on track.
- Missed patterns: Humans can overlook recurring or subtle issues that aren't immediately obvious.
- Poor documentation: Keeping track of fixes manually often leads to incomplete or outdated records.
Pinpointing the Source of Bugs
Without AI, finding the root cause of bugs can feel like searching for a needle in a haystack. Complex issues often hide the real problem, making it harder to fix.
Developers usually rely on these steps:
- Stack trace reviews: Manually digging through error logs and execution paths.
- Checking variable states: Examining multiple points that might trigger the issue.
- Verifying configurations: Ensuring system settings and dependencies are correct.
This process is not only slow but can also introduce new problems, increasing maintenance headaches.
Impact on Project Timelines
Debugging delays can throw off project schedules and drive up costs, especially when deadlines are tight.
Here’s why debugging can stretch timelines:
- One issue at a time: Developers often tackle bugs sequentially instead of addressing multiple problems simultaneously.
- Pulling senior resources: Senior developers are pulled away from building new features to focus on debugging.
- Manual quality checks: Verifying fixes manually adds extra time and creates bottlenecks.
In the next section, we’ll dive into how AI-powered tools can streamline debugging and help you avoid these common pitfalls.
Debug 3x FASTER with Cursor AI MCP Auto Browser Logs ...

AI Debugging Tools Guide
Here's how to choose and use AI debugging tools to address common challenges effectively.
Overview of AI Debugging Tools
AI debugging tools can identify patterns, predict potential bugs, and recommend fixes. Key features include real-time error detection in IDEs, AI-assisted code completion, and automated workflows.
Popular options like Cursor, GitHub Copilot, and Replit can simplify debugging and accelerate development.
Choosing the Right Tool and Budgeting
When selecting a tool, consider factors like subscription costs, integration requirements, ease of use, and the level of support provided. Match these against your project's needs and available budget to make the best choice.
Highlight: Vibe Coding Tools Directory

The Vibe Coding Tools Directory is a one-stop resource for AI debugging tools. It provides access to tools like Cursor, GitHub Copilot, and Replit, along with tutorials and tips for effective prompt usage.
sbb-itb-7101b8c
AI Debugging Methods
Once you've chosen the right tools, use these methods to streamline your debugging process with automation.
Setting Up Error Detection
Enable real-time code analysis to catch errors specific to your project as you write. Here's what to configure:
- Custom Error Patterns: Define rules tailored to your codebase for more precise detection.
- Severity Levels: Prioritize alerts, from critical bugs to minor style issues.
- System Integration: Link your AI debugging tools to your CI/CD pipeline for seamless error tracking.
Task Scheduling for Efficiency
Run resource-heavy scans during off-hours, while keeping lightweight, real-time checks active during development. This approach ensures efficient use of time and resources.
Balancing AI and Human Reviews
Combine AI tools with developer expertise to handle both straightforward mistakes and more nuanced problems.
- AI for Initial Scans: Let AI manage the first round of reviews, identifying syntax issues and performance concerns.
- Developer Oversight: Developers can focus on evaluating business logic, security, and more complex edge cases.
- Feedback Integration: Use developer input to adjust and improve the AI's detection rules over time.
Setting Up AI Debugging
Workflow Analysis
Outline each step in your debugging process. Track the types of bugs encountered, how long they take to resolve, and identify where manual efforts slow things down.
Tool Selection and Integration
Select tools that address your most common bug types and integrate them using IDE plugins or CI/CD APIs. Incorporate review checkpoints that pair AI-driven scans with developer reviews. Finally, set up performance tracking to evaluate how AI influences your debugging efficiency.
Wrapping It Up
This guide has walked you through tackling debugging challenges and setting up AI tools to enhance your workflow. AI debugging tools can help you detect errors faster, improve code quality, and simplify bug fixes. Begin by incorporating AI-powered error detection, then implement task scheduling and regular review checkpoints as suggested. Combine AI's automated scans with developer oversight to handle intricate logic and security issues. Check out the Vibe Coding Tools Directory to find top AI debugging tools and keep improving your process.

